Join Our Club its free: JMJ Investment Club Check out our new guide: The Ultimate Guide to Trading Range Days
Good morning traders, yesterday we saw the best short of the year so far. However, it may be possible to see one of the best single day longs right behind it either today or next Friday. Yesterday we can chalk up to exhaustion gaps across some of the big market cap stocks like Meta. Even though we fell from the sky yesterday I am not too concerned about falling through the floor right now. Although it is possible for us to slide a bit more, I see us holding the bottom around 448 if we are not already going to hold the 451. The 451 area is important because it is where the current uptrend on the daily is perceived to be over. Keep in mind there is still positive momentum on the monthly but the changing trend on the daily will go a long way to crushing momentum on the monthly. We need the monthly to change so the weekly will change then the weekly will change before the monthly can change. In the meantime, expect to see increasing volatility as the range starts to expand and higher time frames start to take control in the midst of momentum shifting events.
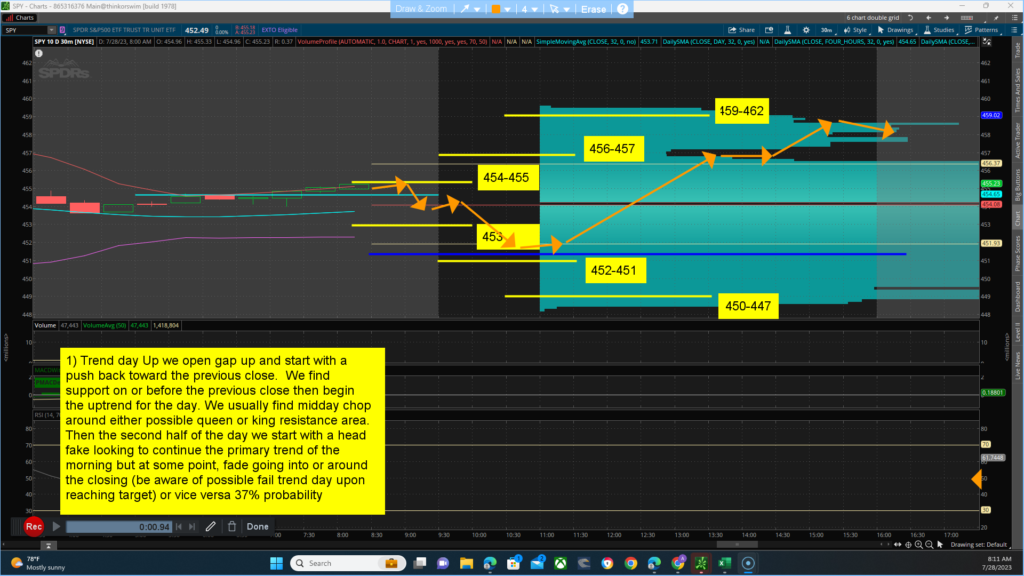
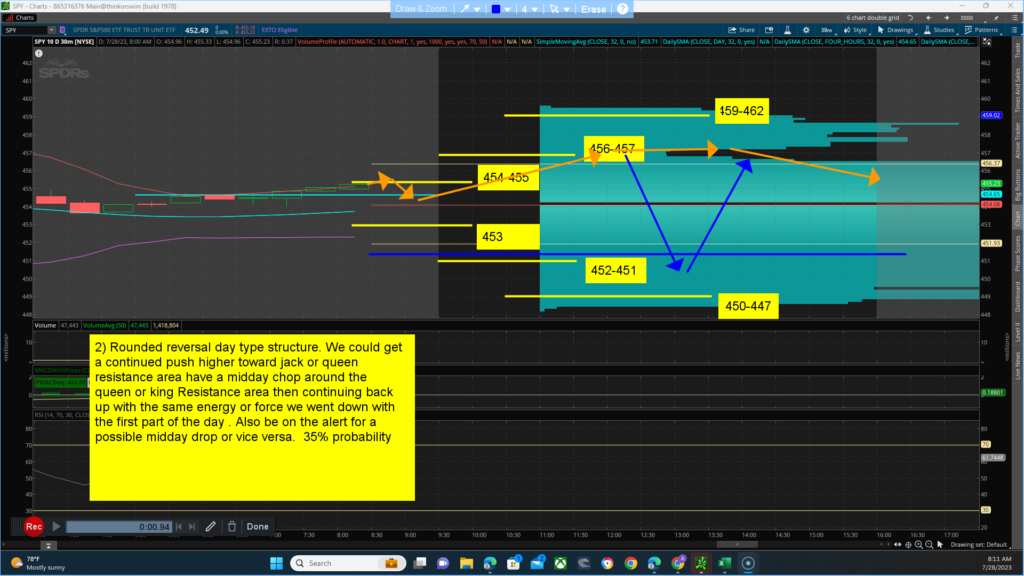
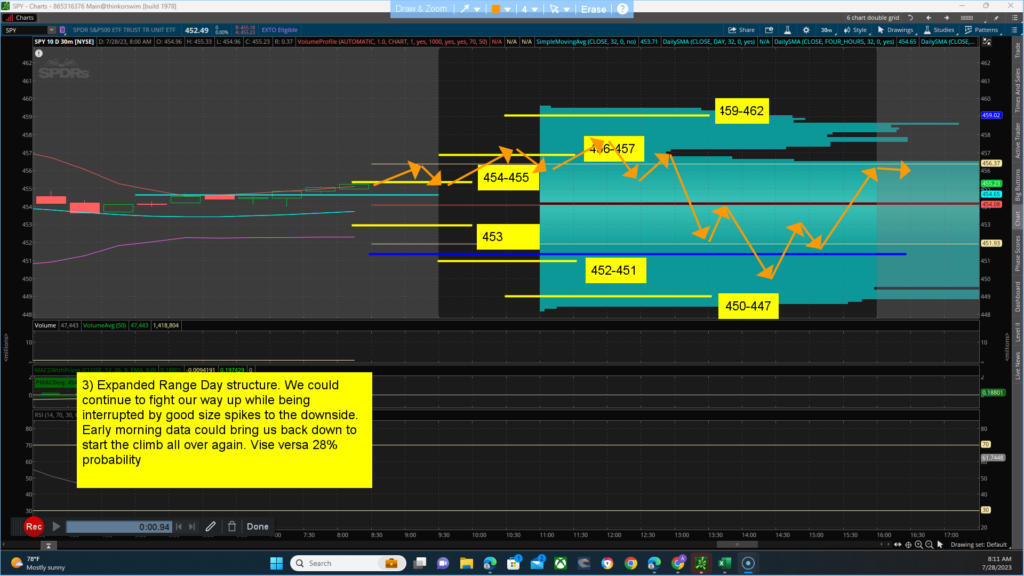
Key levels to watch for … Resistance (jack) 454-455 (queen) 456-457 and (king) 459-462 area. Support (jack) 453 (queen)452-451 and (King)450-447. The main thesis for the day is a BULLISH bias closing above 452.49 with a projected target/high of between 452-462. Alt thesis is BEARISH bias closing below 452.49 with a projected target/low of between 452-447. The main channel we are in is between 453-471. Yesterday, market strength and breadth opened at highs of the day and took the escalator down all day. I expect strength to start gap up and elevated from where we left off yesterday giving us a scary moment thinking that the price action will continue to slide like yesterday but consolidating at some point in the morning and powering up the majority of the day. We have dissonance between the technical side which is (Bearish) and the Quant side (bullish bias). The futures have a bullish bias for the day with dissonance between the technical side (50/50) and the Quant side (bullish) Be on the lookout for the 4-hour chart meeting its resistance mid-day and going back down to retest and possible push thru lows of overnight to break the trend on the daily chart time frame. Scenarios for the day:
- 1) Trend day Up we open gap up and start with a push back toward the previous close. We find support on or before the previous close then begin the uptrend for the day. We usually find midday chop around either possible queen or king resistance area. Then the second half of the day we start with a head fake looking to continue the primary trend of the morning but at some point, fade going into or around the closing (be aware of possible fail trend day upon reaching target) or vice versa 37% probability

- 2) Rounded reversal day type structure. We could get a continued push higher toward jack or queen resistance area have a midday chop around the queen or king Resistance area then continuing back up with the same energy or force we went down with the first part of the day . Also be on the alert for a possible midday drop or vice versa. 35% probability

- 3) Expanded Range Day structure. We could continue to fight our way up while being interrupted by good size spikes to the downside. Early morning data could bring us back down to start the climb all over again. Vise versa 28% probability
