Join Our Club its free: JMJ Investment Club
Check out our new guide: The Ultimate Guide to Trading Range Days
Good morning traders, It’s been awhile since I have posted a premarket, but I am working to get back to being at my desk each morning after a lot of family and business distractions. Let’s look at the technical side of what’s going on right now. There is good news and bad news about what is happening in the cycle. The both good and bad things about where we are from a technical standpoint are that the weekly timeframe is in control, and we are in an area I like to call a rest area. The rest area usually happens at a line in the sand in which the market has exhausted in trend / or run and the market has to rest. The analogy is that the market is a marathon runner and there are places along the course where you get water breaks, and the runner slows down and kind of runs in place while it refuels or hydrates. This is a point on the weekly where we are refueling and running in place while doing so. The bad thing about it is that on the weekly this is a huge range that we can run in place through, approximately 455-430. Now while we run in place on the weekly timeframe let’s highlight another part of the analogy, the other timeframes run like a relay race as each timeframe has to run its lap and hand the baton off to the next relay runner. Since the weekly is running over such a large area the smaller relay races are forced to run faster and bigger laps to keep pace. We are no doubt headed to test and possibly break the bottom of the weekly range. However, the even larger timeframe the monthly is still in its overbought phase where we could at some point with breakneck speed go back and retest highs in the overall market after finding support below 430ish. This will get us out of the weekly rest area and start the smaller cycles over at not such a hasty pace. The bad news after all of this is that the damage will be done and that there will be no positive tailwinds on the fundamental side to keep us trending up when we get through this weekly technical cycle. This sets us up for an even steeper correction that will slide us off into a recession. The headwinds that we will have to face after coming through this weekly cycle will be higher energy prices, a stronger dollar, more inflation with higher interest rates with slower growth. Then people will realize that all the Fed has done is bought time for the market to fall from a higher cliff.
I haven’t done a lot of trading the last couple of weeks but I have been in some XLU puts for over a month or more they are up close to 40% they have 8 days left will be looking for an exit on those soon. I have a few 10-dollar wide Vix spreads that are starting to wake back up some I have been in since July 19th and they have 12 days left and some I have been in since August 14th and they have 40 days left. Hopefully I will be able to exit the first set in the next two weeks as I am expecting a Vix to push up to 25 within the next two weeks. Finally, I have a few spy 444 puts I have been in a couple weeks that are now up 84% but looking to roll out and down today or tomorrow to lock in some profit.
Key levels to watch for … Resistance (jack) 445-446** (queen) 447 and (king) 453 area. Support (jack) 444* (queen)443*-442 and (King)441-435. The main thesis for the day is a BULLISH bias closing above 446.22 with a projected target/high of between 447-450. Alt thesis is BEARISH bias closing Below 446.22 with a projected target/low of between 445-441. The main channel we are in, is between 453-425. Yesterday, market strength and breadth rallied off the open to highs of the day and pretty much failed until midday and rallied into the close. I expect strength to do the opposite of yesterday, open at lows of the day rally a bit into midday and then start to fall apart again going into the close. We are already outside the lower edge of the weekly market makers expected move so there is no real script on what happens today. We have harmony between the technical side which is (Bullish) and the Quant side (bullish bias). The futures have a bullish bias for the day with harmony between the technical side (bullish) and the Quant side (bullish) HOWEVER BECAUSE THE WEEKLY IS IN CONTROL THIS INTRADAY SIGNS MEAN NOTHING. We could get sharp turn back up but at some point, it will get faded. Scenarios for the day:
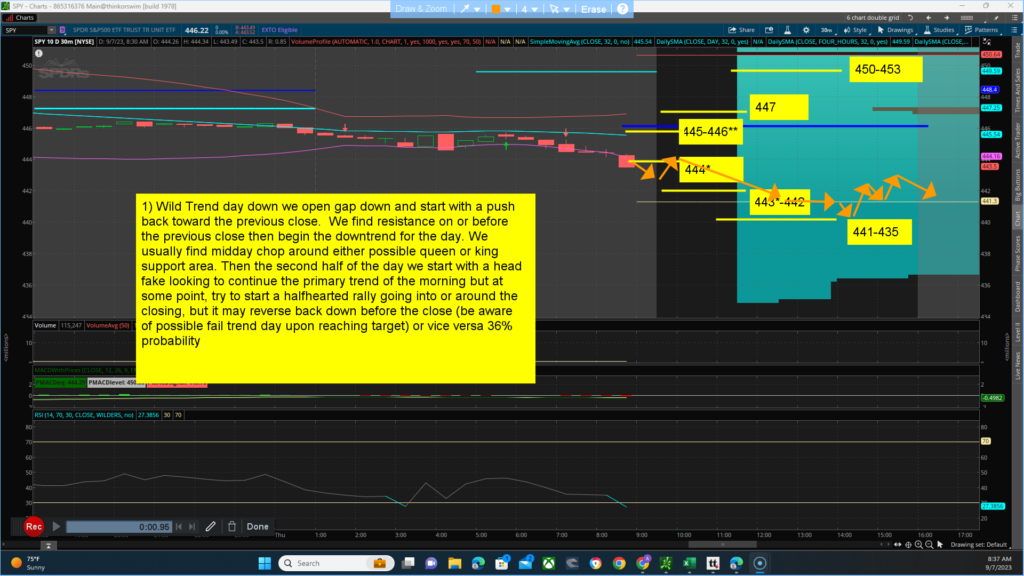
- 1) Wild Trend day down we open gap down and start with a push back toward the previous close. We find resistance on or before the previous close then begin the downtrend for the day. We usually find midday chop around either possible queen or king support area. Then the second half of the day we start with a head fake looking to continue the primary trend of the morning but at some point, try to start a halfhearted rally going into or around the closing, but it may reverse back down before the close (be aware of possible fail trend day upon reaching target) or vice versa 36% probability

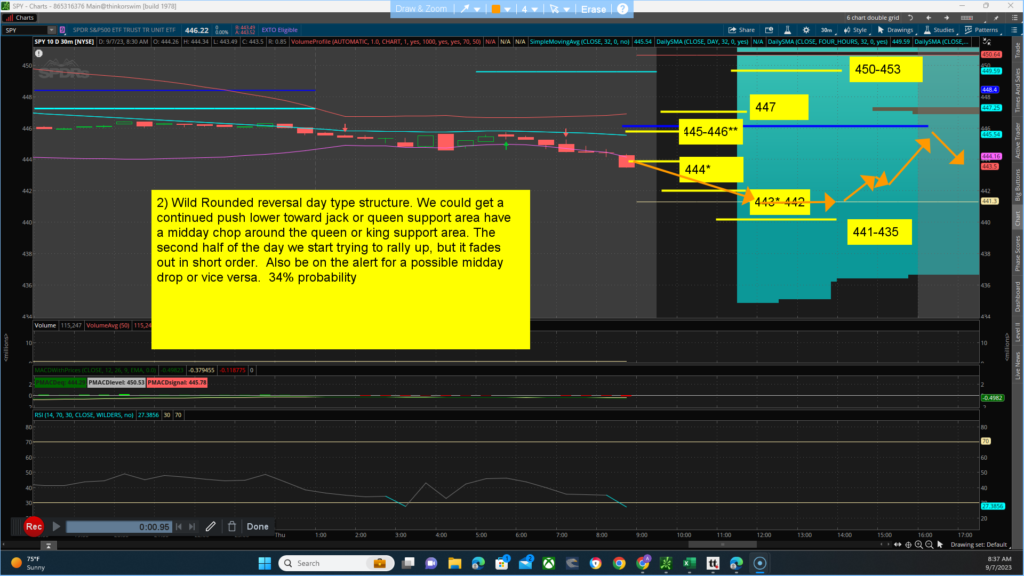
- 2) Wild Rounded reversal day type structure. We could get a continued push lower toward jack or queen support area have a midday chop around the queen or king support area. The second half of the day we start trying to rally up, but it fades out in short order. Also be on the alert for a possible midday drop or vice versa. 34% probability

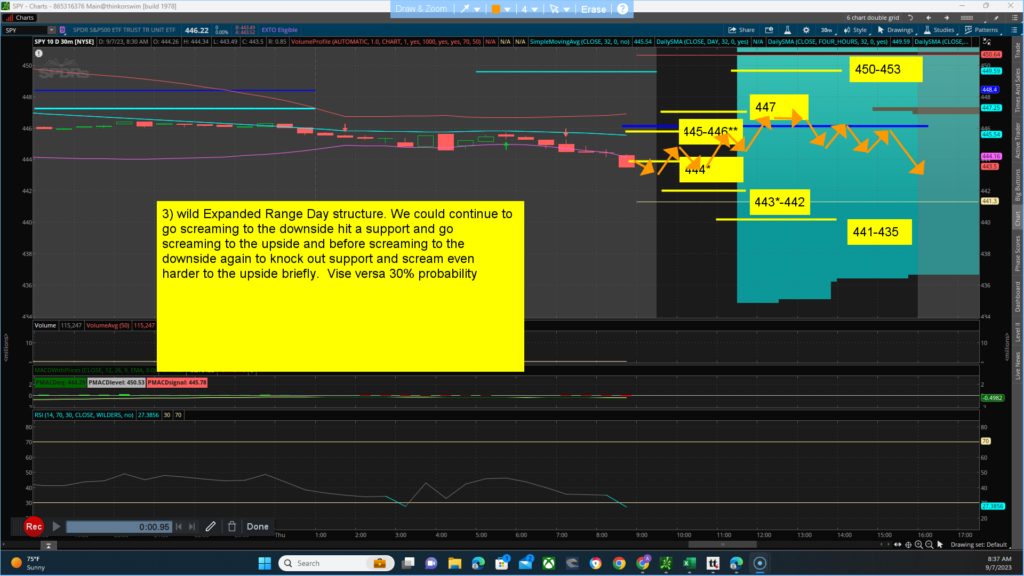
- 3) wild Expanded Range Day structure. We could continue to go screaming to the downside hit a support and go screaming to the upside and before screaming to the downside again to knock out support and scream even harder to the upside briefly. Vise versa 30% probability
